


We have all been there. It is the end of the month, and you are trying to understand how your business performed.
You have one tab open for Facebook Ads to check your spend. You have another tab open for Shopify to check your sales. You are logged into your email marketing tool to see open rates, and you have a spreadsheet open where you try to combine all these numbers manually.
You are not analysing data. You are just moving it around.
This is the "Data Silo" trap. Your data lives in different houses that do not speak to each other. You can see what happened in each channel, but you cannot see why it happened across the business. Did your email campaign drive that spike in website traffic, or was it the influencer post? When you look at tools separately, you are relying on guesswork.
The solution is not just another report. It is a unified AI dashboard. This is a system that pulls every single data stream, from your bank account to your warehouse sensors, into one central brain.
This guide explains how connecting your data sources works, why it transforms decision making, and how you can stop being a data entry clerk and start being a strategist.
The Problem with Fragmented Truths
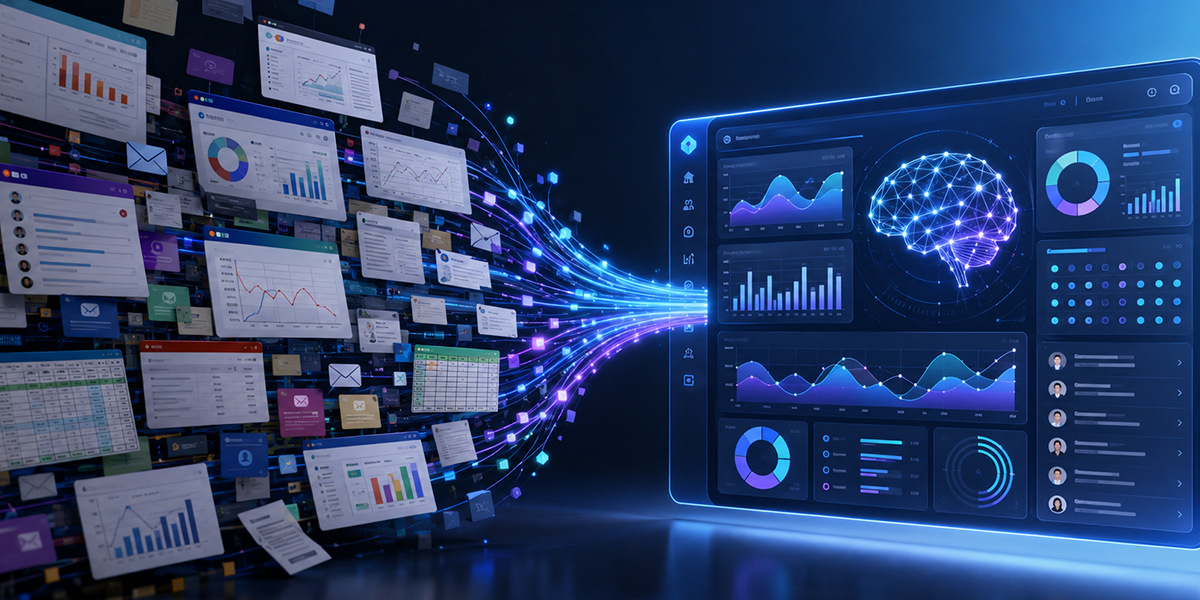
Most businesses run on a stack of five to ten different software tools. Each tool is excellent at its specific job, but they are terrible at sharing information.
This creates "Fragmented Truths."
Your CRM says you have 100 leads. Your email tool says you have 80 active subscribers. Your sales team says they only spoke to 50 people. Who is right?
When you operate without a unified dashboard, you spend hours every week just reconciling these numbers. You waste time arguing about which spreadsheet is up to date instead of discussing how to grow.
A unified AI dashboard eliminates this debate. It acts as the "Single Source of Truth." It connects to the API (the digital backdoor) of every tool, pulls the raw data, cleans it, and presents it in one standardised view. When everyone looks at the same number, everyone pulls in the same direction.
How AI Turns Connection into Correlation
The real magic happens when you add Artificial Intelligence to this unified data.
Old school dashboards just display data side by side. They show a graph of ad spend next to a graph of revenue. It is up to you to squint at the screen and guess if they are related.
AI dashboards think for you. Because they can see all the data at once, they can spot Correlations that a human would miss.
- Contextual Insight: The AI notices that your refund rate on Shopify spikes exactly three days after your shipping delay alerts go off in your logistics software. It flags this connection for you.
- Cross-Channel Attribution: The AI sees that a customer clicked a LinkedIn ad, then read three blog posts, and finally bought via an email link. It assigns the credit correctly across all three, rather than just giving all the glory to the email.
This is the difference between "reporting" and "intelligence." Reporting tells you what happened. Intelligence tells you how the moving parts affect each other.
The Technical Reality: APIs and Pipelines

You might be wondering how the data actually moves. You do not need to be an engineer to understand the concept.
Think of your dashboard as a universal translator.
- Ingestion: Your developer sets up "Pipelines" that plug into your various software tools (Salesforce, QuickBooks, Google Analytics).
- Normalisation: Each tool speaks a different language. One calls a sale a "Conversion," another calls it a "Transaction." The system translates these into one standard term.
- Storage: The clean data is stored in a secure warehouse (like a digital vault).
- Visualisation: The AI reads from the vault and builds the charts you see every morning.
This setup runs automatically. You do not press "refresh" or upload CSV files. The dashboard is alive, updating in near real time.
Why This Is a Custom Build, Not a Software Subscription
Many "all in one" tools promise to do this for you. They rarely work for growing businesses.
Why? Because your business is unique. You might use a specific legacy inventory system that the generic tool does not support. You might calculate "profit" differently than a standard ecommerce retailer.
Off the shelf tools force you to change your business to fit their dashboard. A custom solution fits the dashboard to your business.
This brings us back to our main resource: The Top 10 Freelancers who build AI Analytics Dashboard for Business Intelligence. These are the architects who can look at your specific stack of software, no matter how messy, and build the custom pipelines that bring it all together. They turn your chaos into clarity.
Final Verdict
Data silos are the silent killer of agility. If you have to open five tabs to answer one customer question, you are moving too slowly.
Connecting your multiple data sources into one AI dashboard is not just a convenience; it is a competitive necessity. It gives you a "Control Tower" view of your entire operation, allowing you to spot bottlenecks and opportunities that are invisible when you look at tools in isolation.
However, this is a technical challenge. It involves APIs, authentication keys, and data schemas. Do not try to glue this together with basic plugins.
To get a reliable "Single Source of Truth," you need a specialist. Head to Legiit, browse the experts in AI Analytics, and find a partner who can wire up your business for the future.
FAQ: Unified Data Dashboards
What data sources can I connect to an AI dashboard?
Almost anything with a digital pulse. Common connections include advertising platforms (Meta, Google), CRMs (HubSpot, Salesforce), financial tools (Xero, Stripe), e-commerce stores (Shopify, WooCommerce), and even custom internal databases.
Do I need to know how to code to manage this?
No. You need a developer to build it, but once it is running, it is designed for business users. You simply log in and look at the charts. The maintenance (making sure the connections stay open) is usually handled by automated scripts or your freelance partner.
Is my data secure if I put it all in one place?
Yes, often more secure than having it scattered. When you centralise data, you can apply enterprise grade security protocols to that single vault, rather than managing fifty different passwords for fifty different tools.
Can AI really predict trends from this data?
Yes. Once the AI has access to historical data from all your sources, it can run "Predictive Modelling." It can look at your sales trends from last year, cross reference them with your current ad spend, and forecast your revenue for next month with surprising accuracy.
How long does it take to build a unified dashboard?
A basic setup connecting three to four main tools can often be built in a few weeks. A complex enterprise system with dozens of custom integrations might take a month or two. The timeline depends on how "clean" your current data is.







 Download